Workforce Optimization Survey: Time For The Next Level

and President of
Strategic Contact.
Strategic Contact, working with Contact Center Pipeline, recently conducted the 2017 Workforce Optimization (WFO) Survey. A sampling of 291 contact center practitioners weighed in on how they plan for, deploy and leverage WFO solutions. This article explores what the results tell us about the value and opportunities WFO technology presents, as well as the challenges companies face in deploying and delivering business value. We also highlight some changes from our 2014 survey.
Here’s a key takeaway from the combination of the survey input and what I see happening every day: It’s time to take these tools, and the related processes and roles, to the next level; the market has us poised to do just that.
Leaders and Laggards
Investment profile is one area where size seems to matter. Overall, 47% characterize themselves as middle-of-the-pack, mainstream technology users (similar to 2014). The distinction jumps out in who is more willing to adopt technology earlier. Nearly 24% of centers over 100 seats indicated they take an industry-leading, state-of-the-art approach to technology investment. In contrast, only 6% of smaller centers take that leap, leaving a greater percentage characterized as laggards (42% of smaller centers vs. 31% of larger centers).
We were curious who submits and owns the budget for contact center technology, and found a fairly even distribution between the contact center and IT at about one-third each. The balance is driven by business units (~21%) and a combination of executive leaders or CC and IT together.
| Who Answered the Survey?
Industries represented (in order of participation level): |
||
| A Wide Spectrum of Centers
The demographics of our study participants provide wide-ranging perspectives on contact center use of WFO products and services. The input represents diverse industries and center sizes, from very large (1,000+ FTE) to very small (less than 25) centers. Since scale of operation matters when it comes to WFO, we sliced some of the data by center size, looking at key questions for the 1–100 seat segment versus the 101+ seat centers. Executives, operations managers and analysts (approximately 75% of participants) provided an interesting perspective of WFO technology planning, purchase and use. It’s sprinkled with some “in the trenches” views from supervisors and IT, as well. |
|
Participants by Center Size
(FTE Equivalent) |
WFO Success and Ambition
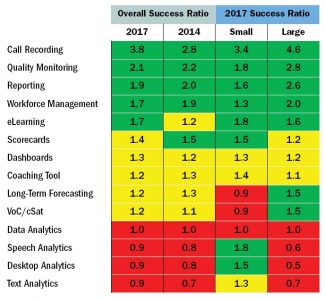
Our favorite question is about technology use, providing insights into not just which technology centers have invested in but whether they use it effectively. I call the ratio between those two the “Success Ratio”—and of course, the higher, the better. TABLE 1 shows the results for 2017 and 2014, and for small and large centers.
Participants also share what is under way and what’s on their wish list. Collectively, this input provides great ammunition to centers where the terms “best in class” or “world class” get thrown around routinely. If you want to put your money where your mouth is, you need to keep up (or get ahead) with the technology in place or in progress. You also must invest in resources and processes to use it effectively (as other data will show).
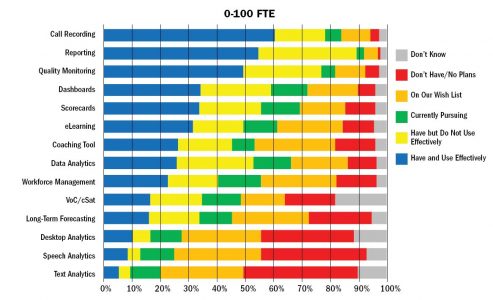
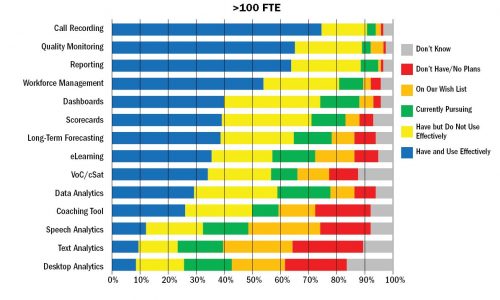
WFO use is widespread across many different solution types, as shown in FIGURE 1. Traditional, mature (and arguably less complex) tools such as Call Recording, Reporting, Quality Monitoring (QM), and Workforce Management (WFM) have the highest adoption rates as well as the best success ratios.
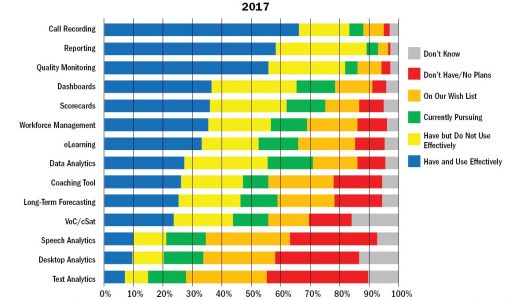
Analytics tools, which are still “hot” in the market, have relatively low use but are high on wish lists or plans to pursue. As expected, there is more data analytics which in many cases may come from enterprise solutions that are not just specific to the contact center. Speech Analytics, perhaps the “hottest of the hot” is the next most common form of analytics. It is still making headway with only about 20% penetration, but approximately 42% of participants are currently pursuing it or putting it on their wish list.
Unfortunately, the analytics tools have the lowest success ratio (1 or less), with the likelihood of using it effectively being about equal to (or less than) the likelihood of not using it effectively. Speech, text, desktop and data analytics all fall into this range. Scorecards and dashboards, related and important tools, fare a little better with a 1.3–1.4 success ratio.
As reflected in these success ratios, many of the WFO components have a high percentage that do not use the tools effectively (average over 20%, with reporting the worst at nearly 31% not using it effectively). These numbers are similar to 2014 and again shine a light on the need to invest in people and processes alongside technology.
It’s no surprise that the larger centers have a greater abundance of WFO tools and more in the works, as FIGURES 2 AND 3 reveal. Smaller centers have much lower use of WFM and forecasting tools, but they are working hard on pursuing or wishing for WFM (nearly 40%). Their other top priorities align with the big centers: Analytics. More big centers have and are pursuing analytics, but size doesn’t keep the smaller centers from wanting it—or from using it effectively when they do have it, as TABLE 1 shows.
Invest in Resources to Align Use and Value
Nearly 75% of participants told us a key goal of WFO tools is to improve the customer experience; 67% also said that they focus on improving agent performance. Those are clear priorities for a strong majority. Cost reduction and efficiency made the top three goals for 45%, followed by process improvement at 26%.
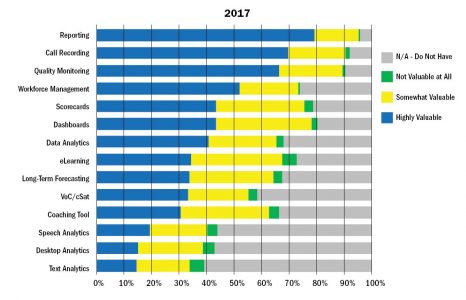
FIGURE 4 shows the more basic tools like call recording, reporting and QM all line up with “have and use well” in delivering greater value. From there, we see a bit of a drop. The good news is the “not valuable at all” ratings are few, but the responses show clear opportunity to do more with these tools.
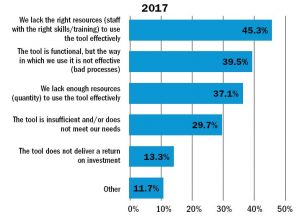
So what holds them back? FIGURE 5 shines the spotlight on resources—the right ones, and enough of them. Certainly there is opportunity to use it better, whatever the resources available, but we can confidently call people a prerequisite to success. A significant percent (30%) also let us know the tools aren’t cutting it, which may reveal bad choices, implementations, training, or other issues. The challenges to implementation put lack of internal knowledge and experience (45%) and resource time (42%) strongly at the top of the list. The keys to success seem to point to resources again. Other challenges noted were integration, budget overruns, and user adoption, training, and change management.
Nearly two-thirds have dedicated WFO users in the center—and we consider that a good thing. Similar to 2014, about 22% have resources in an Analytics group and 18% in IT. These options can work with the right culture, engagement, and accountability. Wherever they sit, they need to be the right resources with the proper tools, skills and training.
| Is the Cloud for Real? Will Best-of-Breed Deliver More Value? | |||
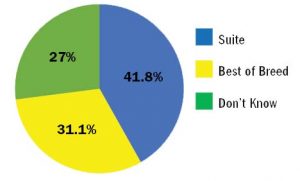
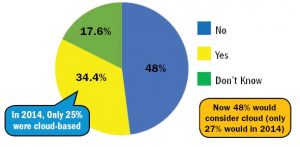
| A Significant percentage (42%) of participants use a suite approach to WFO, getting several solution elements from a single vendor (the common phrase of “one throat to choke” come to mind). A smaller number (31%) use a best-of-breed approach, independently choosing point solutions for each element. The quest for specific functionality can increase the | burden on resources in the center and IT to configure and manage the tools effectively. The best-of-breed users consistently show they derive higher value, with scorecards, dashboards, and data analytics showing the greatest difference. However, unlike 2014, Speech Analytics fared better for the suite users in 2017. | We saw about a 10% increase in participants using cloud solutions for WFO-now up to 34% of all participants. The percentage who said they would consider cloud leapt to 48% (up from 26% in 2014) and the “No” to cloud dropped from 22% to 16%. These numbers clearly validate cloud as a viable option for many. | |
| Suite or Best-of-Breed | Cloud Based Today? | ||
Investment Plans
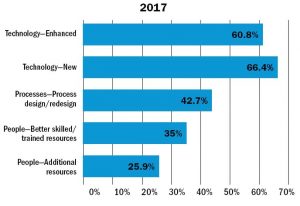
Participants have plans to invest: 37% within the next 12 months and another 15% in the 12–24 month timeframe. FIGURE 6 shows the targets for investment. Technology, both new and enhanced, is again the priority, and for a greater majority than before. Process and people investment plans have dropped, which raises concern for driving value based on the other inputs. We saw a similar disconnect in 2014; technology may still look like the “silver bullet” to some. A full two-thirds of large centers and 60% of small ones cite budget limitations as the thing that holds them back from investing in WFO. About half—53% of small centers, 47% of large centers—point to other initiatives having higher priority.
What Did YOU Learn?
Whenever we conduct a survey, it’s fascinating to dive into the data and see what it tells us, and how that syncs (or doesn’t!) with what we see on projects, in the market hype, or in talking to people at conferences. I invite you to dive into the data and see what it tells you. The full survey results are available here: www.strategiccontact.com/surveys/Workforce-Optimization-FullResults-2017.pdf. I’m also going to share a few thoughts that combine my experience with what I see in the input shared by our survey participants.
FROM OPTIMIZATION TO ENGAGEMENT
Our “Challenges and Priorities” (C&P) survey the last two years has put attrition as the No. 1 challenge. Clearly, it has a huge impact on many centers, for a myriad of reasons. And the 2016 C&P survey showed the top priority is coaching and development; related items such as metrics, performance management, and training ranked high, as well. Many of the WFO tools align with these priorities and challenges, and can help improve attrition if used in a positive way. But our data in this survey (and others) shows centers often fall short in using technology effectively and driving value. The performance demands and impact of things like budget limitations and turnover put even the best leaders on their heels instead of moving forward.
Yet major market analyst firm Gartner recently renamed their “Workforce Optimization” technology review (reflected in what they call a Magic Quadrant) Workforce Engagement Management (WEM). They emphasize the WFO market is mature and the tools now need to address employee engagement, while still driving operational performance optimization. These are noble goals I can readily agree with, and I bet you can, too.
So here is our challenge as an industry: As we mature with WFO (and pursue WEM), let’s do it right! The track record shows we have some gaps to close. As we gear up to do more, let’s get the basics right and build from there.
IT’S ALL ABOUT THE PEOPLE
Building on this optimization to engagement message, the survey data puts a big target on people. Enough resources. The right resources. Properly trained. Leveraging tools to their potential. Given enough time and focus to do the job they were tasked to do (and not just help fight the next fire). Changing processes on the front line as well as support functions to drive value for customers, the center and the corporation.
This is not a new message. But it’s a drum worth beating, and beating louder as companies find it easier to buy technology and harder to hire people. Or as the survey shows, when the investment focus is more on new and enhanced technology, but the challenges point to people.
Key Findings
|
THE CLOUD
Speaking of easier to buy, chances are there is a cloud WFO solution for you. It could help you solve some challenges relatively quickly, with little or no upfront cost. It might have snazzy browser-based (or mobile!) user interfaces that make it easy to use. These promises can directly address some of the issues our survey reveals—including putting less demand on people to drive value from technology.
I don’t want to oversimplify what’s possible with the cloud, or paint it as the solution for everyone. But I am heartened by the results that show companies are using and considering WFO cloud solutions. These solutions change our market—cost structures, complexity, ways of buying… And they could potentially change the outcome of WFO technology pursuit.
Lori Bocklund is Founder and President of Strategic Contact.
– Reprinted with permission from Contact Center Pipeline, http://www.contactcenterpipeline.com


